Managing Change Requests – This Is How I Do It With Can Do
Change Requests Are Part of Everyday Project Work – In Our Team Just as Much as With Our Clients
In many workshops or...
Earned Value Analysis (EVA) is an automated calculation that allows an extended view of the progress of a project or other element in the project.
Translated, it would be called earned value analysis or benefit value analysis. Essentially, it is a matter of putting the current progress of a project (percentage figure) in relation to the work performed (actual work). This key figure is set in a further relation to the planning.

Based on the progress (%) and today's date, Can Do calculates how much work (according to planning) should actually be invested in the project. This value is now compared with the actual recorded work or (if no time recording is used).
The difference is displayed graphically and tabularly for the selected element.

EVA is always displayed on the left for the entire project and on the right for the selected object. The red vertical line shows what the optimal value would be, i.e. progress and work compared to the current time (daily line) are ideal. So exactly as much work is done as planned and progress is also exactly as planned.
The blue bar shows the actual progress. If the bar is shorter (as shown on the left) the project runs slower, if it crosses the red line more work is done.
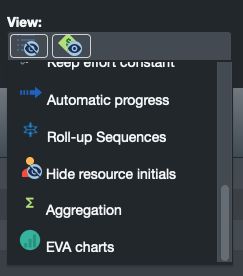
In Can Do, this analysis can be accessed in the Project Planner app. In the "View" tab there is a listbox "Plot". There the display can be shown.

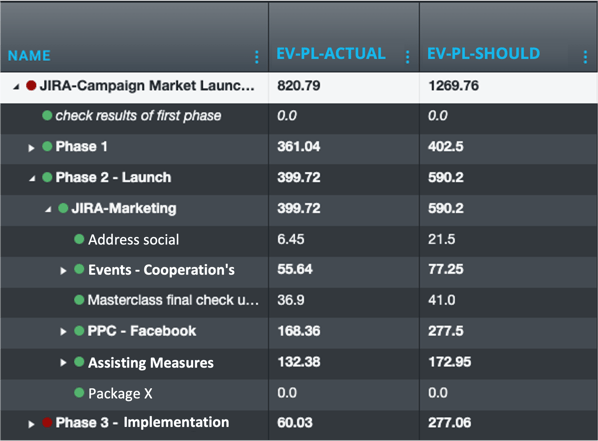
In addition, you can view the values in the table area for the entire project. Under the "Table" tab, simply select the "Work" table.


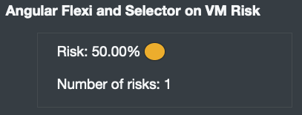
In addition, a small statistic of the risk situation for the selected element is shown.

Even though this had nothing to do with EVA originally, we simply still had space.
This switch can then be used to select between planned work or reported work for the EVA.

As a member of the management board, Thomas is responsible for the operative management of the development including conception, design and further development of the software. He also advises customers on best practices and supports the roll-out.
Change Requests Are Part of Everyday Project Work – In Our Team Just as Much as With Our Clients
In many workshops or...
Decisions have to be made constantly in project and resource planning. What happens if an important project starts...
The ME+ app was developed to help employees and teams manage their working hours and tasks more efficiently. It is...